How to turn your quiz results into original research content (and why you should!)


We get it. When you create a quiz and collect A LOT of juicy data, you might be hesitant to share the results publicly.
Maybe you think the data is boring and nobody will be interested, or maybe you’re just not sure how to share the data properly.
In this article, we’re going to tell you the benefits of using your quiz results and turning them into original research (and how to do it effectively).
So here it goes. Why should you turn your quiz results into original research content, and, more importantly, how?
What is original research content?
Original research content is exactly how it sounds, it’s content based on original data and findings. It’s unique because it’s never been done before… at least, it hasn’t been done the same way.
Normally, if you were thinking of doing original research, you would have to:
- Create a survey (Online or offline)
- Think of 20-50 questions to ask
- Find enough people to take the survey
- Assess all the data to find the common themes
- Present the research and data in a helpful and interesting way
This sounds like a lot of work, doesn’t it?
Luckily for you, you’ve already done the hard work. You already have a quiz where people are happily answering questions and telling you everything you need to know to create valuable research-driven content. If not, learn more about quiz marketing here.
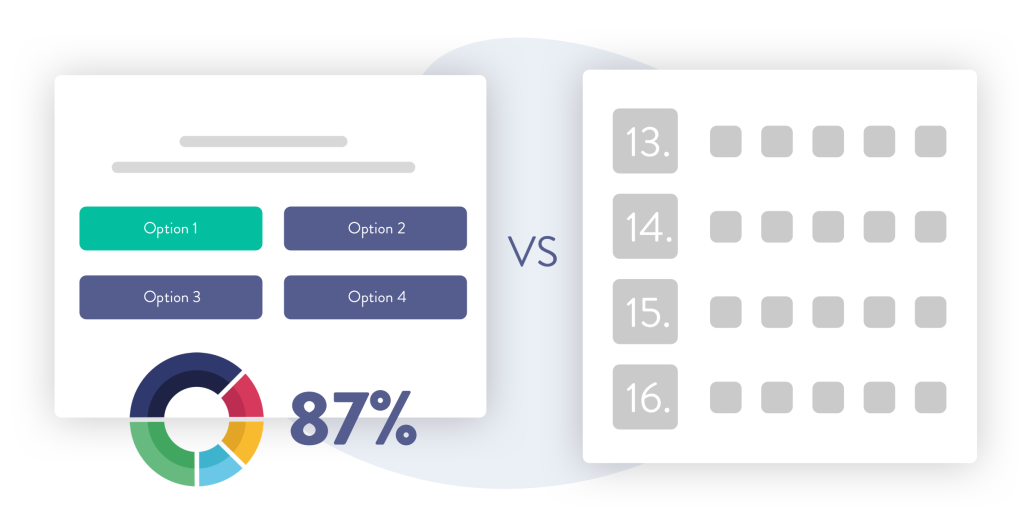
Why you should use a quiz and not a survey for your original research content
When a lot of businesses want to do original research, they think, ‘I have to create a survey.’ After all, they are ‘surveying’ their audience in order to find common trends and interesting data.
But this thinking is not going to deliver the results you want.
When someone stops you in the street or calls you from that unknown number and says, ‘would you mind taking a survey?’ You don’t generally think: ‘hurray, this is going to be so much fun.’
When people hear the term ‘survey’ they know there’s nothing in it for them (and no, the chance to win a £20 Amazon voucher is not compelling!)
This is why quizzes work so much better. Because when you frame your data-collection as a ‘quiz’ your participants know they’ll gain something out of it.

You’re not asking them for a ‘favour’, you’re promising them something in return for filling in the quiz. This is especially true when you use quiz software that includes an overall score and a helpful results page, depending on how they answered your quiz questions.
How can I use a quiz to create original research content?
When we think about the differences between surveys and quizzes, we often think that surveys are data-driven and factual, whereas quizzes are just for fun. But if you do it right, there’s no reason why you can’t use a quiz to ask some “survey-type questions” that can be used within your research.

It’s all about mixing up the questions–having a few in there that give you the data you want, and also questions that will help your audience understand where they stand and where they need to improve.
Surveys vs quizzes: who wins for data gathering?
Surveys
❌ Your audience doesn’t get anything out of it
❌ You have to do a lot of convincing to get your audience to participate
❌ Your audience thinks it only benefits you
❌ Surveys don’t typically convert into sales
Quizzes
✅ Your audience gets something in return
✅ Your audience will be excited to take your quiz
✅ Your audience thinks it benefits them
✅ You can sell directly from your quiz, even on the results page
What are the benefits of original research content?
So you know that a quiz will help you create original research content, but you might think to yourself, well why should I publish original research?
Why would you give your competition access to the data you’ve worked hard for?
We get it. It can feel daunting releasing some of the results of your quiz, especially when your competitors are watching. But the benefits far outweigh the costs (we promise!)
What are the benefits of creating original research content based on your quiz results?
1. You instantly build authority
Your competition might be able to see your original research content, but they won’t own it. You do.
When you publish original research, you can become a trusted leader in your industry–the person or company that developed new, original data based on in-depth research of their audience.
2. You become the original ‘source’ – and potentially gain a lot of links
When you’ve created original research content, often other websites will link to your website. You become the ‘original source’, and that means you can potentially gain links from some high-authority websites.
Backlinks from other websites act as positive “votes” which tells Google your site is trustworthy and authoritative. This could increase your overall rankings in the search engine results, bringing you lots of organic website traffic.
3. You can use the data to sell
You can use the data from your quiz to help you sell your products and services, for example, imagine you’re an accountant who wants to promote a new bookkeeping service. Now imagine you’d pulled together the results from your quiz that showed participants who used bookkeepers gained five hours a week back in their business.
You can easily see how you could use this in your sales messaging.
How can you present your quiz data as original research content?
So here’s the nitty gritty bit. You have the results from your quiz, but how can you turn those results into original research content?
And how can you do it, so you maximise ROI?
1. Turn your quiz results into a blog post
By turning your quiz results into a blog post, you can:
- Position yourself as an authority in your industry
- Increase the links to your website
- Perform better in search engine results
But the question is, how can you turn your quiz results into a blog post?

Luckily, it’s quite easy to do. You’ve already done the hard part, which is to ask your audience questions and get them to give you their answers.
That’s usually the most difficult part!
To turn your quiz results into a blog post, you’ll want to explain what you have found and what this means for your audience. Find the most interesting facts from the quiz data and explore each statistic one by one and what it could mean.
So let’s say you have a quiz about personal finances.
You could report that ‘52% of respondents stated that they don’t have at least three months’ salary in savings.’ Then you could go on to say what that meant, why it’s important and what your view is about having at least three months worth of savings. You’re essentially the expert commenting on the data.
You can also look for correlations between answers. So, for example, you might find that the people who don’t have at least three months’ worth of savings are more likely to state that they feel stressed and worried about money.
Use the data to paint a picture of what is happening right now, and use your own expertise and experience to explain the results and what they mean.
You can even invite experts in your industry to comment on the results too. This allows you to connect with other leaders in your industry and invite them for input, which will mean your blog post gets more shares.
Finally, try to use visuals throughout your blog post, not just text. Graphs and charts perform well and allow your reader to skim read the content without the need to read every word.
Quick tips on how to turn your quiz results into a blog post
- Don’t just tell us what the data is, tell us what it means. Give us your expert opinion on why the results are as they are
- Invite other industry leaders to comment on your research too, which will increase shares
- Make your blog post visual by using graphs and charts
2. Turn your quiz results into a press release
By turning your quiz results into a press release, you can:
- Increase your authority by being featured in the press
- Increase links to your website from ‘high-authority’ websites
- Become more trustworthy (having been featured in the press)
But how can you turn your original research into a press release?
Did you know that 39% of journalists want to be pitched an article that contains ‘exclusive research’?

That means you have a HUGE advantage when it comes to pitching journalists, because you have original research.
But you have to do more than simply ‘state the facts’. Like the blog post, you have to find the story behind the data, explain what it means and why the journalist you’re pitching to should care about it.
For a press release, this all comes down to having the right ‘hook’, i.e. presenting your research in a way your journalist (and the news outlet’s audience) will find interesting.
Let’s go back to the personal finances example, your hook might be that ‘self employed people are 84% more likely to struggle to get a mortgage.’ That’s a powerful statistic, right?
In the press release, you might want to comment on why you think this is, what hurdles self employed people face, and, more importantly, what self employed people can do to improve their finances before applying for a mortgage.
The hook is what will draw people in, but your advice and expertise will make them stay.
Quick tips on how to turn your quiz results into a press release
- Find your hook–is there one or two really good statistics you can reference and frame your press release around?
- Don’t just relay facts, give your opinion and advice
- Use third person when writing a press release. Remember this isn’t coming from you, it’s coming from the news organisation itself
- You can feature a quote from yourself in the press release as ‘expert opinion’ on why the results are as they are
3. Turn your quiz results into an infographic
Yes, infographics are still very much a thing! If you don’t know, an infographic is a way of displaying data as one large graphic. They’re highly visual, hugely popular and a great way of showing your quiz results!

By turning your quiz results into an infographic, you can:
- Get your message across faster–we humans are visual creatures and we’re much more likely to understand something if it’s displayed in a visual way
- Sell more–when your message gets through quicker and easier, you can potentially sell more
- Makes your content even more sharable
How can you create an infographic based on your quiz results?
Okay, so you’re not a graphic designer. That’s okay, because you can easily use software like PikToChart to create your infographic for you.
The aim of an infographic is to help your audience understand your data in the simplest way possible. It’’s highly visual, so keep your text to a minimum!
It’s important you use visual elements to your infographic, like pie charts, bar charts or even icons and doodles.
Quick tips on how to turn your quiz results into an infographic
- Keep your text to a minimum–no filler words!
- Use a variety of different graphics to showcase your data
- Use a tool like PikToChart to help you create your infographic
- Add your infographic to your blog posts
Your quiz data is valuable original content
We hope by now you can see the true potential of your quiz results. Your data is a goldmine that can potentially bring you better search engine rankings, more website traffic and more leads. As well as position you as an industry leader too!
There are huge benefits to releasing your data, and yes, even though your competition will see it, it’s still worth it.
If you’re not quite at the stage where you’ve set up your quiz to collect your data, then now is the time to check out ScoreApp.
Our quiz software gives you powerful results on how your quiz participant has answered your questions, including viewing overall scores, category scores, every answer to every question, geo location and more for every lead. Even those that don’t complete the quiz!
With ScoreApp, you have everything you need to create a quiz your audience will LOVE that will give you lots of juicy data too. And you can easily turn that data into authority-building, high-ranking content.


